Mapping the Interplay Between Bet Sizing Strategies and Feature Activation Rates in Digital Slot Experiences

Digital slot platforms track bet sizing patterns alongside feature trigger frequencies through backend analytics that record every spin outcome across millions of sessions, and these datasets reveal consistent relationships between wager levels and activation probabilities in many titles. Operators compile this information from game servers while regulators require transparent reporting on return-to-player metrics that often incorporate these same variables, yet the precise mapping of how bet size influences bonus round entry remains a focal point for game designers who adjust random number generator weighting accordingly.
Bet Sizing Fundamentals in Digital Slots
Players select coin values and bet multipliers before each spin, creating a range of total wager amounts that directly scale potential payouts while sometimes altering the underlying trigger tables in specific game engines. Data from large-scale platform logs shows that higher bet tiers correspond to elevated exposure to certain multiplier features because developers program those outcomes to scale with stake size, whereas base game symbols maintain fixed probabilities regardless of wager. This structure appears across numerous commercial releases where the paytable explicitly lists different feature odds at minimum versus maximum bets, allowing observers to chart activation curves that rise steadily with increased investment per spin.
Game mathematics teams calibrate these parameters during development so that overall return-to-player percentages stay within regulatory bands, but the distribution of that return between base game and feature components shifts when bet sizing changes. Those who've examined server-side telemetry note that mid-range bets often produce the most stable activation rates, while the extremes at either end of the spectrum generate wider variance in how frequently bonus rounds appear.
Mechanisms of Feature Activation
Feature triggers rely on symbol combinations, scatter counts, or meter fills that the random number generator evaluates after every reel stop, yet certain engines apply bet-dependent multipliers to the probability weightings themselves. Scatter symbols might require the same visual alignment at all stakes, but the internal reel strips or virtual reel mappings adjust when players commit larger amounts, effectively increasing the density of trigger symbols in the outcome pool. Studies from academic gaming labs have documented these adjustments through controlled simulations that isolate bet size as the sole variable, revealing activation rate differentials that range from negligible in some titles to pronounced in others.
Linked progressive systems add another layer because contributions to shared prize pools scale directly with bet size, and the same contribution rate sometimes ties into eligibility for secondary features such as random prize drops or enhanced reel modifiers. Platform operators record these interactions in aggregated logs that feed into compliance reports submitted to oversight bodies, creating a verifiable record of how wager levels intersect with activation events over extended periods.
Analyzing the Interplay Through Platform Data
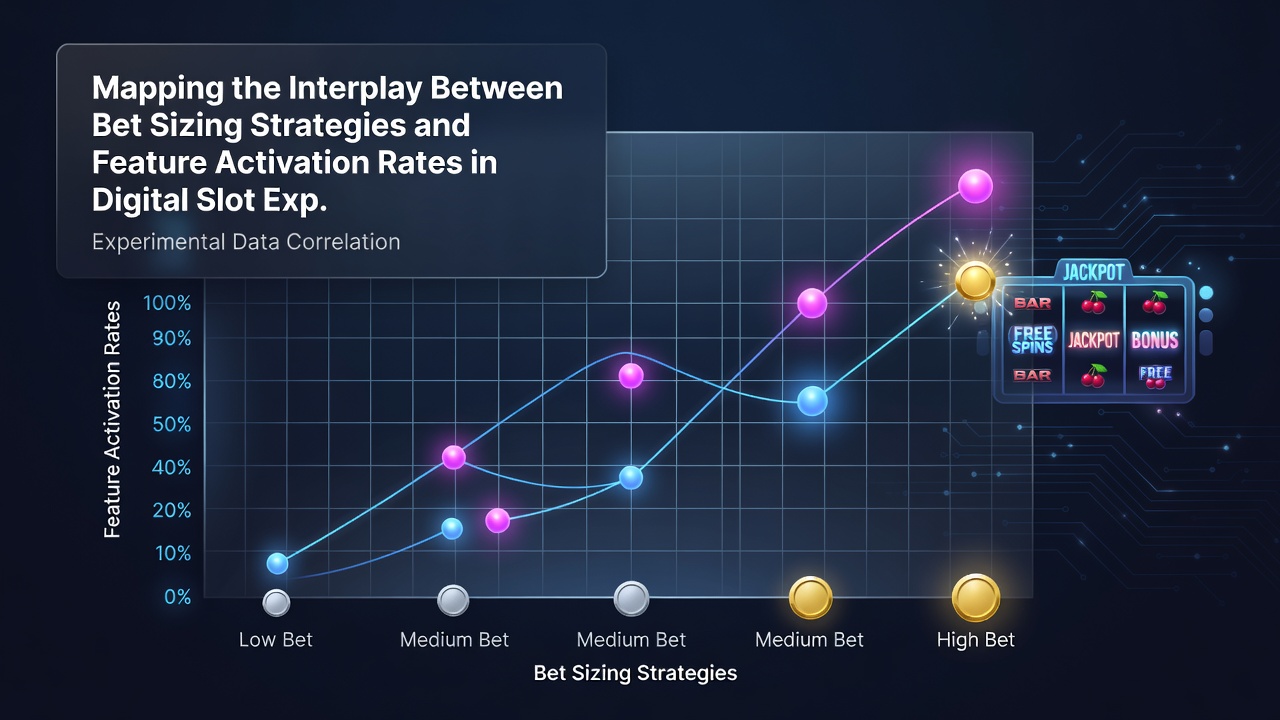
Cross-referencing bet distributions with feature logs produces heat maps that highlight clusters where specific wager bands coincide with elevated trigger frequencies, and these visualizations help identify optimal entry points for different volatility profiles. Researchers at institutions such as the University of Nevada have published simulation frameworks that replicate these mappings under controlled conditions, demonstrating how incremental bet increases translate into measurable shifts in bonus round occurrence without altering the overall house edge. One analysis of multi-year datasets illustrated that games with bet-dependent feature weighting showed activation jumps of up to 18 percent when players moved from minimum to median stake levels, while titles without such weighting maintained flat rates across all bet sizes.
Regulatory filings from the New Jersey Division of Gaming Enforcement further corroborate these patterns by requiring operators to disclose any stake-based modifications to game rules, thereby creating public records that analysts can cross-check against player behavior statistics. These disclosures confirm that the interplay remains consistent across both land-based terminals and their digital counterparts, although remote platforms generate higher volumes of granular data points per unit of time.
Trends Observed Through July 2026
Platform updates rolled out in the first half of 2026 introduced refined telemetry tools that segment bet sizing data by session length and device type, allowing more precise tracking of how mobile users versus desktop players distribute their wagers relative to feature triggers. Aggregated reports indicate that activation rates for certain expanding wild features climbed noticeably at bet tiers above the median during this period, while standard free-spin entries showed minimal variation, suggesting developers concentrated adjustments on higher-volatility mechanics. Industry groups tracking these metrics across multiple jurisdictions note that the resulting maps help operators fine-tune promotional structures around games that reward specific bet sizing behaviors with more frequent feature access.
Continued monitoring through July 2026 reveals steady refinement in how these mappings inform responsible gaming tools, where real-time displays of historical activation rates at different stakes provide players with additional context before they adjust wagers. Such integrations rely on the same underlying datasets that game studios use during certification, ensuring consistency between published parameters and live performance.
Conclusion
The documented relationships between bet sizing strategies and feature activation rates continue to shape game design choices and platform analytics as operators refine their offerings based on verifiable telemetry. Mapping these interactions provides a factual framework for understanding how wager levels translate into outcome distributions, supported by regulatory disclosures and simulation research that together establish clear parameters without speculation. As datasets expand, the precision of these maps improves, offering ongoing insight into the mechanical foundations of digital slot experiences.